I certainly wouldn't rule any of this out (fundamentally), nor have we seen enough from the market to confirm what may be developing, but I do listen and look closely for market evidence that may be suggesting a 'shift' vs the talking TV pundits, who confuse/interfere clear headedness. Again, this is another reason why I focus on a systematic trading scheme - to minimize subjective bias in trading; which reminds me of Nate Silver's latest book 'The Signal And The Noise', which among many topics looks fundamentally at the divergence of human forecasting/opinion (call it prediction, heuristic, bias) from the unfolding outcomes of those (forecasted) events.
The interesting part of yesterday's Momentum Long Signal has to be attributed to the breadth of the signal across equities - both intra-market large cap tech names (AAPL, GOOG, PCLN, AMZN, ISRG) and other major US averages (Russell 2000, S&P500, DJIA). Yesterday the NQ delivered a 'Spring' - new low in the early part of yesterday's trading (lower than the previous 2 days), to close greater than the closing price of the previous 2 trading days. This is a momentum reversal pattern signal that was delivered within the actual 'Momentum Signal.'
To re-cap my trading positions:
1. NQ Momentum Swing: Long Entry (Nov 28) 2651.75
2. NQ Short Swing: :Long Entry (Nov 19) 2579
3. GC (Gold) Momentum Swing: Short (Nov 28): 1714.50
The intraday chart below shows the NQ LE-2651.75, offsetting previous Momentum Short Swing from Oct1 at 2783.5 for 131.75 pt profit (To calculate $ profit: 131.75 x 20 (multiplier) x # contracts traded).

We can also visualize this from the Day chart level below. The 'set' of green arrows represents the 2 'long signals' discussed above:

And the Gold trade, which generated an important liquidation signal SE-1714.5 yesterday, which I believe was triggered by the 'Iranian Trade Sanction' - which may prove to be short term noise - as nothing meaningful has happened in the Gold market as of yet. We would need to see the price move < 1713 level and get accepted there. Yesterday, GC tried to go lower and reversed back into the weekly channel (blue lines) in line with the equities trade higher. We saw rising volumes and a wide range day in GC, which would imply some reversion before continuation if this trade is 'true'. Weak action in the Gold would see it break before the end of the week and into December. Gold has been quietly supported in the last 2 months and anything meaningful will take gold outside the weekly range. My stop for GC sits at 1760. I would not be surprised to see gold continue to bounce around the 1755-1713 weekly range. It was interesting to see however, the risk trade come back into the equities yesterday, with a inverse trade in the Gold. Also, the Gold equities have been taken down and have actually disconnected from the metal. I was expecting to see the equities lead the metal lower, earlier in the trade (Short Gold Equities) -- and yesterday we saw a bit of reversion (gold lower, gold equities higher). GG (Goldcorp - NYSE) was taken higher yesterday on a 'Bear Hook' pattern, which has downside risk expectations or implied short trend continuation. See the chart below of GG breaking below the critical 40 threshold. If GG stays < 40, I wouldn't be surprised to see the metal go lower in line with yesterdays signal. Going back over the past 4 years, December is associated with intermediate trend-change for Gold. We should see increasing volatility in gold going forward.

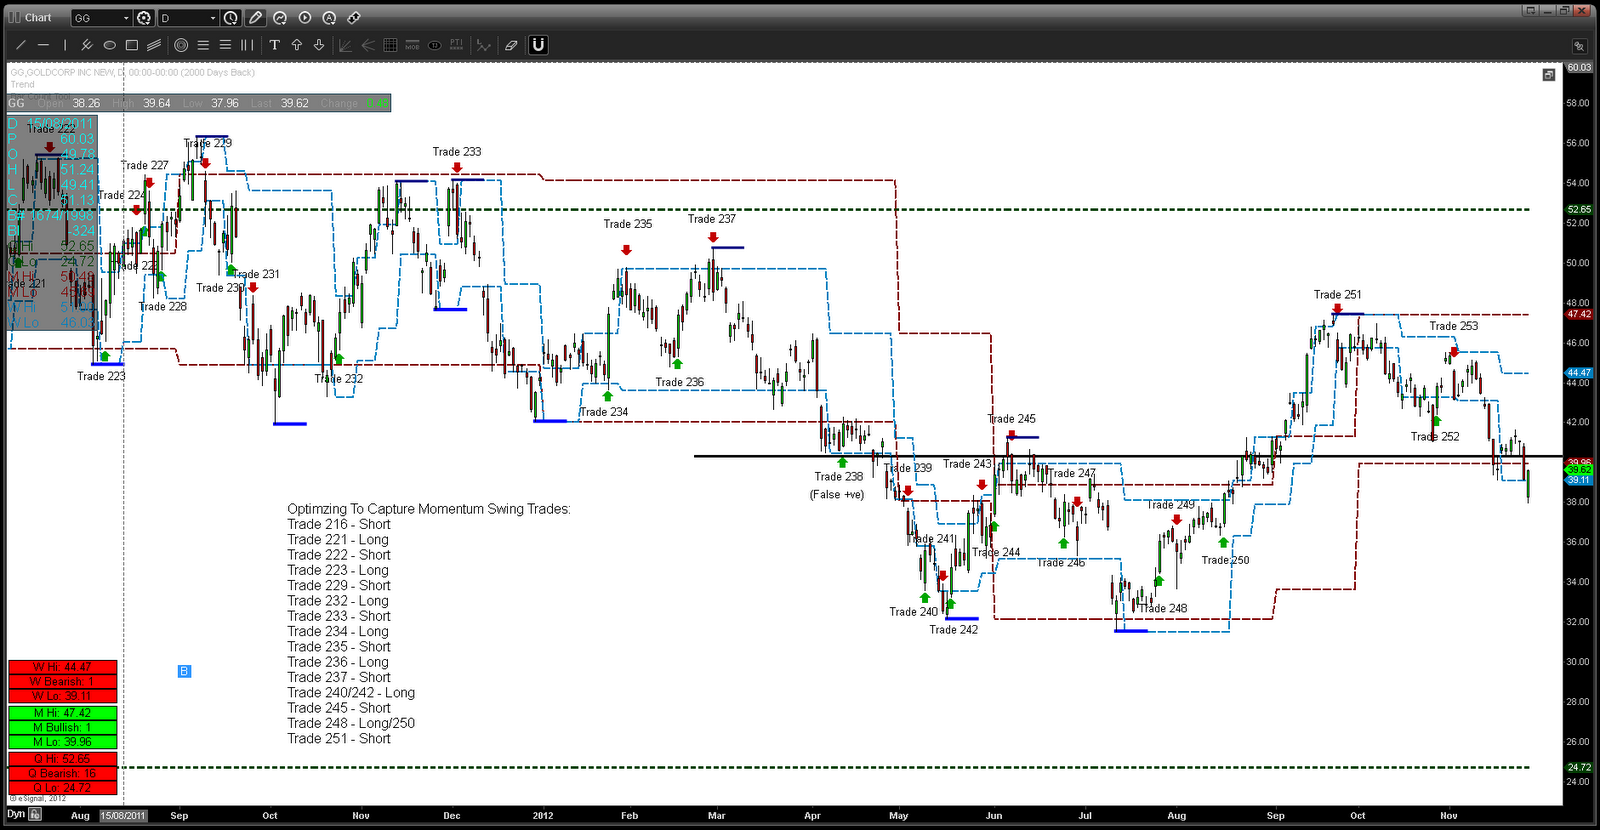
Below we can view the Gold-GG (Gold Equity) correlation from the day chart since Aug 2011. We can see a very direct correlation between the two, suggesting that GG is getting cheap again and 'needs to revert' or the Gold is due to move lower to close the price-gap.

