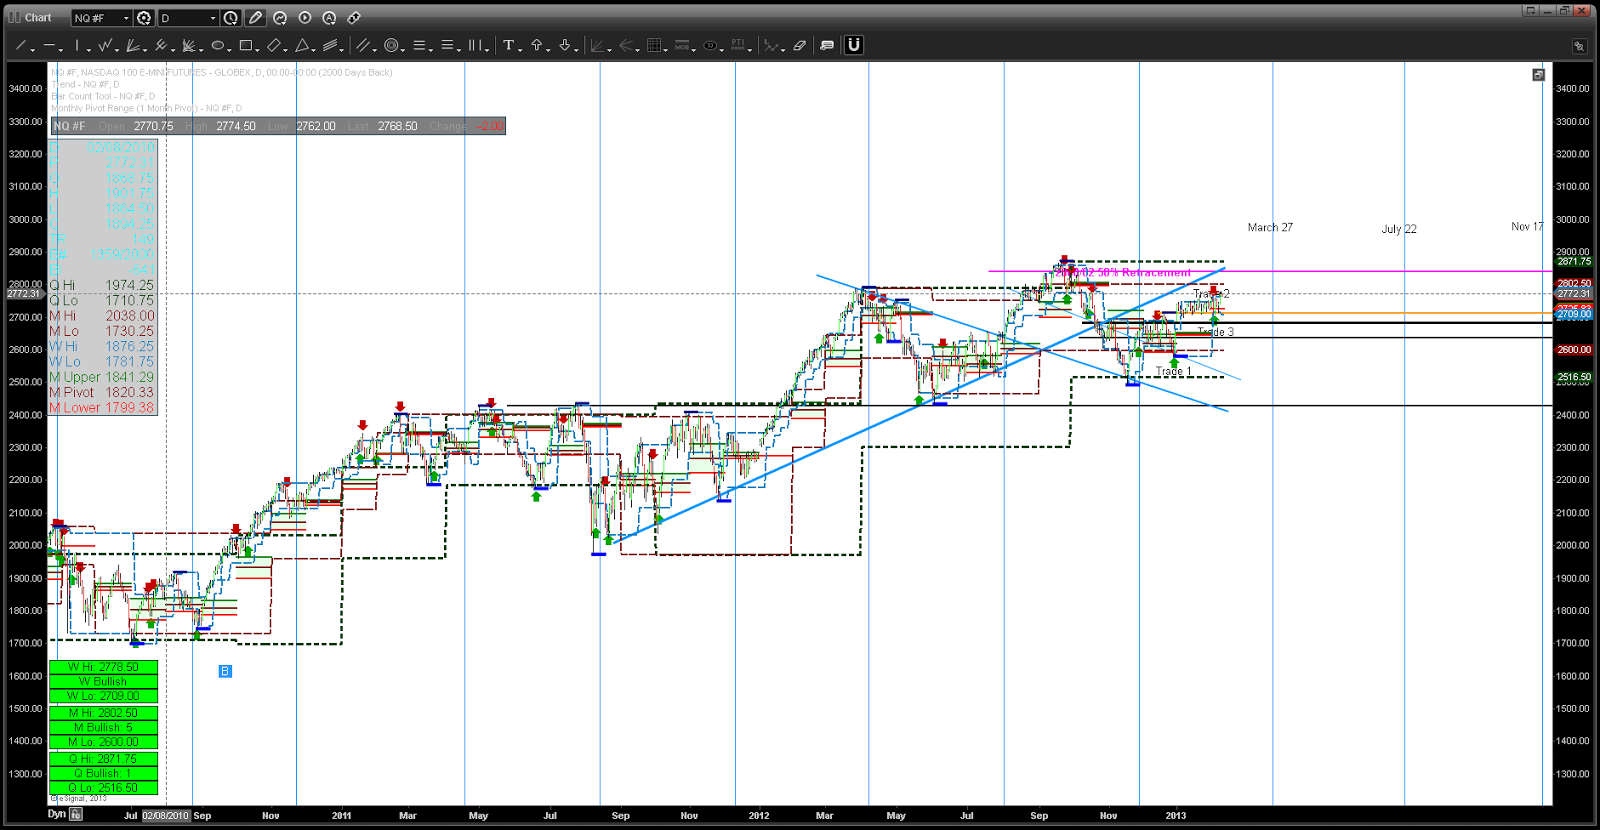
My initial expectations for the NQ in Jan-Feb time frame was to far exceed the current performance to the upside - in line with Dow30/SP500, but AAPL has been a weight keeping the NQ essentially range bound. The day chart below shows the NQ_F basically in a holding pattern since the Jan 2 gap open. As per the arrows in 2013 with trade reference attached (1-3), I've been in and out of this market, but virtually a non-trading environment -- and currently long on my Momentum Swing (Trade 3). First upside target is the Monthly High pivot at 2802, which is inline with the 2011 uptrend line (in blue) and the 00'-02' bear market 50% retracement level. With AAPL lagging the market I find it very difficult to make the case for NQ's to clear the 00'-02' 50% hurddle retracement level on this rally. We need to keep an eye on whether the NQ can push to 2802 (Monthly High Pivot) to the upside, or whether it sells below the Feb Regression (labelled below - 2727-2725) first, which would imply possible downtrend continuation going into March.
Things to watch for NQ:
Interested to observe the interaction between price and the Feb-Regression (labelled on the chart). I believe this point on the chart will act as a magnet, drawing price back down eventually. If you cross-section all the Jan price bars - all 21 of them incorporate trading prices through 2727-2725. This is called the Jan 'Point of Control' or Jan Monthly regression which happens to be very prominent, as all bars traded in and through this price level. Short term price momentum is also flat into Feb new highs from the Dec high price as per the 14/21/50 day ROC indicator in the lower tile of the day chart below

Momentum Swing Trades in 2013:
1.Long Entry 2635.25 (Dec 31) - Exit - 2709.75 = 74.5+
2.Short Entry 2709.75 (Feb 4) - Exit - 2757.50 = -47.75
3.Long Entry 2757.50 OPEN
These trades are shown below in the 15min intraday chart as per the LE/SE (Long Entry/Short Entry) signal overlays.

One of the basic tenets of trading is to develop a style or method that synchronizes your emotional constitution with your trading-activity or trading time frame of preference (day vs week vs many weeks vs months vs years). If the extent of your trading activity is not harmonized emotionally, you will develop 'feelings' that will indicate something is not 'right' for you, which is a positive development in the sense that you are on the path to discovering something important about how you should be trading/investing. My purpose in developing the Momentum Swing program to trade in futures, was the product of my trading 'home' discovery or trading time frame that suited my needs, which I stumbled upon through trial and error as a trader wearing many hats. This resulted in a program that was designed to capture intermediate market turning points from which sustainable price trends can develop over a period of weeks to months (the intermediate time frame). In looking to improve the efficacy of Momentum Swing, without over-optimization, by excessive implementation of overused indicators (which will effectively result in an automated program that becomes defunct over time), yet dynamic enough on a macro-level (many weeks - months) that would allow me to sift the ordinary from the extra-ordinary trading opportunities/signals --- times to be pressing the position.
I undertook an extensive study of all the major intermediate highs and lows generated in the Nasdaq100 over a period of 12 years, from which major monthly-quarterly trend shifts developed. By studying the intervals of time or cycles that occur between successive intermediate market turning points, I was able to find a interesting 4 month rhythm to stocks, that signified major rotations in trend --- or a natural ebb and flow --- occurring on a macro-level. This 4 month time cycle further supports the Momentum Swing program as its objective is to capture trends of this duration.
I'm showing you an overlay going back to 2010, that takes specific monthly dates, associated with natural cycle theory, and used in conjunction with intermediate market turning points and projected out into 2013. This becomes a rough guide to develop a sense of expectation in using Momentum Swing. Almost all of the major intermediate turning points shown below are neatly captured by this rhythm or cycle as per the vertical line overlays. As we look out into 2013, it is interesting to see the March 22 cycle termination-initiation date, where we should expect another major intermediate high/low price. Whether we get a major high/low price remains to be seen, but the March 2013 time period represents the 4 year anniversary since the secular bull began. So March is an important month this year. This will be followed by July 22 and Nov 17. I will be using the Momentum Indicator aggressively in line with these dates. So will Trade 3 continue through Feb and into March?